
FEMA’s Map Can Say You’re Safe While Heavy Rain Says Otherwise: The 13 Million-Property Flood-Risk Gap
A new federal analysis found millions of properties with serious modeled flood risk sitting outside FEMA’s high-risk flood zones. The biggest blind spot isn’t always the river or the coast. It’s rain falling faster than streets, yards and drainage systems can carry it away.
A flood map is useful. It is not a force field. Yet that is often how the line gets interpreted during a home purchase: inside the high-risk zone means flood insurance; outside it means one less thing to worry about.
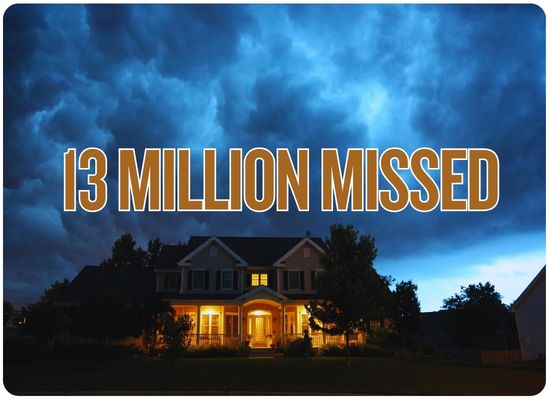
A major federal report released this month shows how dangerous that shortcut can be. Using property-level risk estimates from First Street, the Government Accountability Office found roughly 13 million properties with high modeled flood risk that were not inside FEMA’s Special Flood Hazard Areas.
Most striking of all, heavy rainfall was the predominant threat for nearly two-thirds of the high-risk properties sitting outside those mapped zones.
The 13 Million Number, Explained
The number comes from GAO’s analysis of First Street property-level flood modeling. First Street gives properties a Flood Factor score based on modeled flood likelihood and depth.
GAO treated scores of 4 through 10 as “high risk” because those scores roughly align with the 1% or greater annual flood probability FEMA uses when identifying Special Flood Hazard Areas.
Only a minority were inside FEMA’s mapped high-risk area.
First Street identified 16.03 million high-risk properties nationally. About 2.99 million were inside FEMA SFHAs, 12.80 million were outside them and another roughly 242,000 were in locations without digital FEMA mapping.
The 13 million figure is not FEMA saying it has incorrectly mapped 13 million houses. It is GAO’s analysis comparing FEMA’s regulatory floodplain boundaries with an independent First Street risk model. Different flood models use different methods and can produce different estimates.
The Big Missing Piece Is Water Falling From the Sky
Most people picture flooding as water arriving horizontally: a river comes over its banks, the ocean pushes inland or a creek rises.
Pluvial flooding starts vertically.
Water falls faster than the local system was designed to handle.
Less rainfall can soak into soil.
Stormwater pipes, ditches and culverts reach capacity.
Streets, yards and parking areas become temporary channels.
Water enters garages, doors, basements and low foundations.
Among the nearly 12.8 million high-risk properties outside FEMA’s Special Flood Hazard Areas, 62% had heavy rainfall alone as their predominant modeled flood threat.
That works out to roughly eight million high-risk properties whose primary modeled flood problem was rain rather than coastal surge or a river overflowing its banks.
What FEMA Maps Do — and What They Don’t
| Question | What the FEMA Flood Map Is Good At | Where More Investigation Helps |
|---|---|---|
| River overflow | Identifying regulated floodplains around mapped rivers, streams and waterways. | Small unmapped waterways, changing watershed conditions and extreme events beyond the mapped design flood. |
| Coastal flooding | Mapping coastal high-hazard areas, storm-surge exposure and associated wave zones. | Changing coastal conditions and flood events exceeding mapped assumptions. |
| Heavy rainfall | Some shallow or drainage-related hazards may appear in certain studies. | GAO says SFHAs generally do not account for pluvial flooding from intense rainfall. |
| Street drainage | Not primarily designed as a neighborhood storm-drain capacity map. | Local drainage studies, stormwater models, complaint records and observed street flooding. |
| Insurance mandate | SFHA boundaries help determine whether federal law generally requires flood insurance with certain federally backed mortgages. | Being outside the mandate does not mean flood insurance cannot be useful. |
| Individual property risk | Provides important regulatory flood-zone context. | Elevation, drainage, foundation height, nearby low points and rainfall exposure can materially change property-level risk. |
The Strange Part: FEMA Already Recognizes Rainfall Risk When Pricing Insurance
The regulatory map
FEMA’s Special Flood Hazard Areas are still based primarily on riverine and coastal flood hazards. Those boundaries help determine whether the federal mandatory-purchase rule applies.
The insurance price
FEMA’s newer Risk Rating 2.0 methodology uses more modern property-level information and incorporates additional sources of risk, including heavy-rainfall flooding.
That creates an important distinction homeowners rarely hear explained:
A property can sit outside FEMA’s regulatory high-risk area while FEMA’s insurance-pricing methodology still recognizes rainfall and other property-level risk factors when calculating the NFIP premium.
Zone X Does Not Mean “Won’t Flood”
Zone X is outside FEMA’s Special Flood Hazard Area. Depending on whether it is shaded or unshaded, it generally represents moderate or minimal mapped flood hazard rather than the 1%-annual-chance high-risk area.
That affects the federal insurance requirement. It does not remove water from the property.
Flood claims routinely occur outside high-risk zones.
FloodSmart says almost one-third of NFIP flood-insurance claims come from outside current high-risk flood areas. FEMA explicitly tells homeowners that every flood zone carries some flood risk.
If a property is in Zone X, think “outside FEMA’s mapped high-risk floodplain” rather than “outside flood risk.”
Why the Map Line Changes Insurance Behavior
The new GAO study shows just how powerful the regulatory boundary is.
| Property Location | Estimated NFIP Coverage | Federal Mortgage Rule |
|---|---|---|
| Inside an SFHA | 43% | Flood insurance is generally required when the property secures a qualifying federally backed or federally regulated mortgage. |
| Outside an SFHA | 2% | The federal mandatory-purchase rule generally does not apply, although a lender can still require coverage. |
GAO went further. After controlling for flood-risk level and type, being inside an SFHA was associated with about a 24-percentage-point greater likelihood of carrying NFIP coverage.
In other words, the map boundary appears to influence insurance decisions enormously — even when properties on both sides have substantial modeled risk.
Six Clues Your Zone X Property Deserves a Second Look
If intersections regularly fill during thunderstorms, the drainage system is already showing its weak points.
Surface runoff can reach a garage long before a mapped river gets anywhere near the property.
Water follows elevation, not flood-zone boundaries.
Water backing up at drains during hard rain indicates limited local conveyance capacity.
Past flooding on the same street can reveal a local risk a broad regulatory map does not describe well.
New roads, roofs, parking lots and subdivisions can alter how quickly rainfall reaches local drainage.
Minor channels and drainage features may deserve attention even when the property is outside the mapped SFHA.
Six inches of water across a yard matters much more when the threshold is only a few inches above grade.
Flat neighborhoods can flood when rainfall simply arrives faster than the drainage system can remove it.
Rainfall Flooding Can Still Be an NFIP Flood
Another common misunderstanding is that federal flood insurance covers rivers and storm surge but not rain.
That is not accurate.
The NFIP definition of flood includes an unusual and rapid accumulation or runoff of surface water from any source, provided the event meets the policy’s broader flood definition, including the applicable area/property requirement.
FloodSmart’s agent guidance specifically notes that rain accumulating and flowing into a home can constitute covered flooding. Rain entering through a wind-damaged roof is different and generally belongs under the applicable homeowners or wind coverage instead.
As always, actual coverage depends on the policy wording and circumstances of the loss.
The Financial Gap Can Be Much Bigger Than People Expect
People without flood insurance sometimes assume FEMA disaster assistance will make them whole after a federally declared flood.
The new GAO report shows how different those numbers can be.
Compared with about $88,700 from the average residential NFIP claim.
GAO calculated inflation-adjusted averages for flood-related events from 2015 through 2025. Federal disaster-assistance payments averaged about $3,500 while residential NFIP claim payments averaged roughly $88,700.
Federal disaster assistance is not a substitute for an insurance policy and may not even be available unless the event qualifies for the necessary federal declaration and the household meets program rules.
A Better Flood-Risk Check Than Looking at One Map
Start with FEMA’s map.
Find the official flood zone and understand whether the property sits inside an SFHA. The map remains important for regulation, construction requirements and the federal mortgage-insurance mandate.
Then look for rainfall risk.
Check local drainage studies, municipal stormwater maps, flood complaints and any available property-level flood modeling that includes pluvial flooding.
Walk the property after a hard rain.
Look for standing water, flow toward doors, overflowing drains, erosion, full ditches and water entering from neighboring parcels.
Ask neighbors the useful question.
“Where does the water go when it rains extremely hard?” often produces better information than simply asking whether the house has ever flooded.
Get a flood-insurance quote even if the lender doesn’t require one.
The quote gives you another piece of risk information and lets you compare the cost of transferring the risk against the potential loss.
Check the lowest six inches.
Garage thresholds, crawlspace vents, basement windows, patio doors and low utility equipment often determine whether shallow rainfall flooding becomes an expensive claim.
One More Number That Should Get Attention
Some properties that repeatedly flooded were still outside FEMA SFHAs.
GAO reports that 18% of FEMA’s severe repetitive loss properties — buildings with multiple qualifying NFIP claim payments — were outside Special Flood Hazard Areas.
That is a useful reminder of what a regulatory floodplain can and cannot do. It draws a line needed for national insurance and building rules. Nature does not agree to stop at that line.
Primary research used for this FloodMart report
National Flood Insurance Program / FloodSmart — Understanding Flood Zones
National Flood Insurance Program / FloodSmart — Understanding Flood Risk
National Flood Insurance Program — What Qualifies as a Flood?
FEMA — Risk Rating 2.0 methodology and current NFIP insurance-pricing guidance.
First Street — property-level flood-risk modeling used by GAO. GAO notes that other models with different methods may produce different national estimates.
Flood Map Gap Check
Your FEMA zone is important, but it is only one layer of flood information. This quick screen looks for rainfall and drainage clues that may justify a deeper flood-risk review even when a property sits outside FEMA’s high-risk area.