Urban Flooding in Alabama and Mississippi Just Got a New Risk Model: Why Developed Land Changes the Equation
A new USGS study looked at decades of flood peaks from 64 urban streamgages and found that watershed size alone could not explain urban flood flows. How much of the land had been developed mattered too.
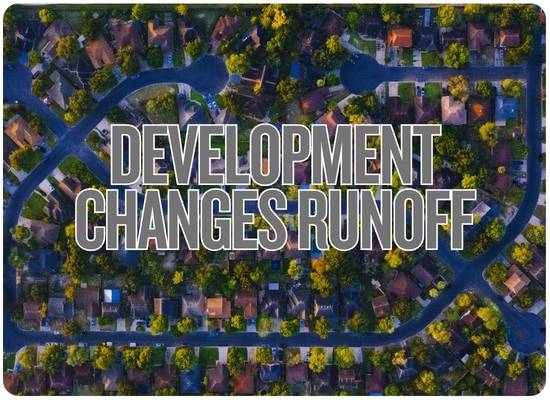
A creek does not know how many houses were built upstream. But it certainly responds to what happened to the ground beneath them. Replace woods and open soil with roofs, parking lots, streets and compacted yards, then connect much of that surface to gutters, pipes and ditches, and rainfall can reach the stream by an entirely different route.
That basic idea has been understood for decades. What changed this fall is that the U.S. Geological Survey now has a new set of flood-frequency equations specifically built around urban streams in Alabama and Mississippi.
One of the two variables that survived the statistical testing was exactly what growing Gulf South communities should be paying attention to: the percentage of the watershed covered by developed land.
What USGS Actually Studied
The U.S. Geological Survey worked with the Alabama Department of Transportation and Mississippi Department of Transportation to update estimates of how much water urban streams can carry during floods of different probabilities.
The final analysis covered 48 streamgages in Alabama and 16 in Mississippi. Many were clustered in and around major urban areas including Birmingham, Huntsville, Montgomery, Tuscaloosa and Jackson.
This wasn’t a short-term rainfall experiment.
USGS analyzed annual peak-streamflow records through the 2024 water year. Some underlying streamgage records extend far back in time, giving researchers a long record against which to estimate floods ranging from relatively common events to very rare extremes.
The study then asked a practical engineering question:
If there is no streamgage at a particular urban creek crossing, what measurable watershed characteristics can help estimate the size of future flood flows?
Two Variables Rose to the Top
Drainage area
How many square miles ultimately send runoff to the location being analyzed? A larger watershed generally has more area capable of contributing water to the stream.
Percentage of developed land
How much of that watershed is classified as developed land? USGS found this variable statistically significant in explaining differences in peak urban flood flows.
Drainage-area range
The final equations were developed using urban stream basins within this drainage-area range.
Developed-land range
The regression watersheds ranged from roughly one-fifth developed to essentially fully developed.
USGS says the accuracy of the equations is unknown outside the basin-characteristic ranges used to build them. These equations also are not intended for streams substantially altered by upstream dams or other major regulation.
Why Developed Land Changes What Rain Does
The storm itself may be identical.
Roofs, pavement and compacted soil reduce infiltration.
Curbs, pipes and ditches concentrate runoff.
More runoff can reach the channel over a shorter period.
The amount of water passing a location during the flood can change.
USGS has documented the basic mechanics for years. Undeveloped land stores some rainfall on vegetation, in soils and in natural depressions. Development removes some of that storage and replaces it with surfaces that shed water efficiently.
Stormwater infrastructure can make that movement even faster. A network of gutters, streets, storm drains and culverts is designed to move water away from buildings and roads—but that also means water can reach downstream channels much more quickly.
Flood risk at one house can change because of development upstream. The parking lot that matters does not necessarily have to be beside your driveway.
The New Model Covers More Than the “100-Year Flood”
The equations estimate peak flows across eight annual exceedance probabilities, or AEPs.
A “100-year flood” does not happen once every hundred years. A 1% AEP flood has a 1% chance of being exceeded in every individual year. Two can occur close together.
The Surprise: Development Matters Less During the Biggest Floods
This is one of the most interesting findings in the report.
The statistical coefficient attached to developed land became smaller as the analysis moved toward rarer, larger floods.
An extreme storm can make rural land behave more like developed land.
During smaller events, undeveloped soil and vegetation can store and absorb considerably more water than pavement. During an extreme event, however, even natural soils can become saturated. Once that happens, additional rainfall becomes runoff too.
That does not mean development stops mattering during major floods. It means the difference in runoff behavior between developed and undeveloped watersheds can narrow as the event becomes extreme.
Development can be especially important to the floods communities experience more often—the kind that repeatedly fill streets, overtop small culverts and put water into low buildings—while an extreme regional deluge can overwhelm developed and undeveloped watersheds alike.
Developed Does Not Automatically Mean “More Than Rural”
The report contains an important warning against turning urbanization into a simplistic rule.
Researchers compared the new urban equations with rural flood equations at 13 Mississippi streamgages used in both analyses.
| Comparison | Number of Mississippi Gages | What Happened |
|---|---|---|
| Urban estimate higher at every modeled flood frequency | 6 of 13 | The urban equations produced larger peak-flow estimates across all AEPs. |
| Urban estimate lower at every modeled flood frequency | 3 of 13 | The urban equations produced lower estimates across the full range. |
| Mixed result | 4 of 13 | The urban estimate was higher at some flood frequencies and lower at others. |
That is exactly why USGS builds regional statistical equations instead of applying a rule such as “development increases every flood by 30%.”
Drainage area, rainfall history, watershed geometry, soils, channels, stormwater infrastructure and other characteristics all affect what happens once the rain starts.
How Reliable Is the Model?
81%–91% of variation explained
USGS reports pseudo-R² values from 81% for the very rare 0.2% AEP flood to 91% for the 4% and 2% AEP floods.
23.1%–36.1% standard error
The average standard error of prediction ranged from 23.1% for the 4% AEP flood to 36.1% for the 0.2% AEP flood.
USGS explicitly says the regression results should not be interpreted as exact. They are statistical best-fit estimates with uncertainty. A calculated streamflow is not a prediction that a specific house will receive a specific depth of water.
This Is a Stream-Flood Model—Not a Street-Flood Calculator
This distinction is important for homeowners.
| The New USGS Study Can Help With… | It Does Not Directly Tell You… |
|---|---|
| Estimating peak flows in urban streams. | Whether water will enter your garage during tonight’s thunderstorm. |
| Designing or reviewing culverts and bridges. | The capacity of every municipal storm drain on your street. |
| Flood-frequency estimates at ungaged urban-stream locations. | Exact flood depth on an individual parcel. |
| Evaluating detention basins and stream-restoration projects. | Whether a particular development caused a specific past flood. |
| Understanding how drainage area and developed land relate to urban peak flows. | A simple universal percentage increase caused by every new parking lot or subdivision. |
Why This Matters in Alabama and Mississippi
The Gulf South has several ingredients that make urban hydrology especially important.
Warm-season storms can dump large amounts of rain over a relatively small watershed in a short period.
Gulf tropical systems can produce unusually large rainfall totals across both states.
New rooftops, roads and commercial areas continually change how some watersheds route rainfall.
The USGS equations specifically address urban basins where peak flow can rise quickly.
Drainage structures built for earlier development patterns may face different runoff conditions decades later.
A stream does not have to enter hundreds of houses for one flood peak to shut down important roads.
What Development Looks Like to a Watershed
| Land Change | Hydrologic Change | Potential Flood Effect |
|---|---|---|
| Roof replaces vegetation | Little rainfall infiltrates through the roof surface. | More water becomes direct runoff. |
| Parking lot replaces soil | Water moves rapidly toward drains or low points. | Runoff becomes more concentrated. |
| Curbs and storm sewers are added | Water reaches receiving streams more efficiently. | Peak streamflow can arrive sooner. |
| Land is graded | Natural depressions and storage can disappear. | Less rainfall is temporarily stored on the landscape. |
| Soil is compacted | Even areas that remain grass-covered may absorb less water. | Effective runoff can increase beyond paved areas alone. |
| Detention is constructed | Runoff can be temporarily stored and released more slowly. | Properly designed controls can reduce or delay downstream peaks. |
EPA’s current stormwater guidance makes the same basic point: development creates impervious surfaces and compacted soils that increase runoff and reduce infiltration, potentially increasing runoff volume, velocity, flood frequency and peak storm flows.
The Homeowner Question Isn’t “How Developed Is My Lot?”
Your parcel is only a tiny piece of the drainage basin.
The USGS variable measures developed land across the watershed draining to the stream location. A wooded backyard does not erase the effect of shopping centers, roads and subdivisions upstream.
This is a useful distinction when residents notice that flooding seems different than it did 10 or 20 years ago.
The right investigation is not simply how much pavement sits beside the house. It is how the entire drainage area has changed, how runoff is being detained or routed, and whether downstream culverts and channels remain adequate.
If New Development Is Going Upstream, Ask These Questions
What watershed does the project drain into?
A development can be several miles away and still contribute runoff to the same creek that passes through your neighborhood.
How much impervious surface is being added?
Buildings, streets, sidewalks and parking areas shed rainfall differently than undeveloped soil and vegetation.
What detention or retention is required?
Modern stormwater controls may be designed to store runoff and limit how quickly it leaves the site.
Which downstream culverts were analyzed?
Moving water safely off one development does not solve the problem if the next culvert downstream becomes the bottleneck.
Was existing development included in the drainage study?
The relevant question is cumulative watershed runoff—not just whether the newest site meets its own design standard.
What happens during a storm larger than the design event?
Ask where overflow goes when detention ponds, channels or storm drains exceed their intended capacity.
A Tool Engineers Can Actually Use
The real power of the new USGS equations is that every creek does not need its own decades-long streamgage record.
For an ungaged urban stream location, engineers can delineate the watershed, calculate its drainage area and developed-land percentage, then use the new regression relationships to estimate peak flows for several flood probabilities.
USGS says its StreamStats application provides the platform for delineating drainage basins, calculating basin characteristics and estimating peak streamflows at qualifying ungaged locations using the regional regression equations.
Those numbers can inform decisions involving culverts, bridges, detention basins, stream restoration and other infrastructure where underestimating flood flow can become expensive—or dangerous.
What Homeowners Should Watch Around an Urban Stream
New upstream development
Do not assume distance means irrelevance. Find out whether the project drains toward the same creek or tributary.
Culvert backups
A culvert or bridge opening can become the controlling bottleneck when peak flow increases.
Faster creek rise
A stream reaching its peak more quickly during hard rain can be a meaningful local observation worth documenting.
New erosion
Bank cutting, channel widening and sediment movement can be signs that runoff volume or velocity is stressing the channel.
Repeated road flooding
A low crossing can reveal changing stream behavior before nearby homes ever experience direct flooding.
Detention performance
If ponds regularly overtop or remain full before the next storm, the watershed may have less usable storage than expected.
What the New Model Should Not Be Used to Claim
| Claim | What the Study Actually Supports |
|---|---|
| “Every subdivision makes floods worse.” | No. Developed-land percentage was statistically important, but stormwater controls and other watershed characteristics matter. |
| “50% developed means 50% more floodwater.” | No. The relationship comes from regression equations and changes with flood frequency. |
| “Urban streams always carry more floodwater than rural streams.” | No. The Mississippi comparison produced higher, lower and mixed results depending on location and AEP. |
| “The model tells me whether my house will flood.” | No. It estimates streamflow, not parcel-level inundation depth. |
| “The equation is accurate anywhere.” | No. USGS defines drainage-area, development and stream-regulation limits for its use. |
| “A 100-year estimate is an exact number.” | No. USGS reports meaningful prediction uncertainty and says results should be treated as statistical estimates. |
Research used for this FloodMart report
U.S. Geological Survey — Magnitude and Frequency of Urban Floods in Alabama and Mississippi Using Data Through the 2024 Water Year, Scientific Investigations Report 2026-5044, September 24, 2026.
U.S. Geological Survey — Results of Weighted Least-Squares Regression for 42 USGS Streamgages in Urban Areas in Alabama and Mississippi.
U.S. Geological Survey — At-Site Flood Frequency Estimates for 64 Urban Streamgages in Alabama and Mississippi Using Data Through Water Year 2024.
U.S. Geological Survey — StreamStats watershed and streamflow-estimation system.
U.S. Geological Survey — Effects of Urban Development on Floods.
U.S. Environmental Protection Agency — Urbanization, Hydrology and Stormwater Runoff guidance.
U.S. Environmental Protection Agency — 2026 municipal stormwater guidance describing the effects of impervious surfaces and compacted soils on runoff and peak storm flows.
Urban Watershed Development Check
This is not the USGS regression model and does not calculate flood discharge. It helps identify whether an Alabama or Mississippi urban-stream location resembles the range studied by USGS and whether local development conditions deserve a closer drainage review.