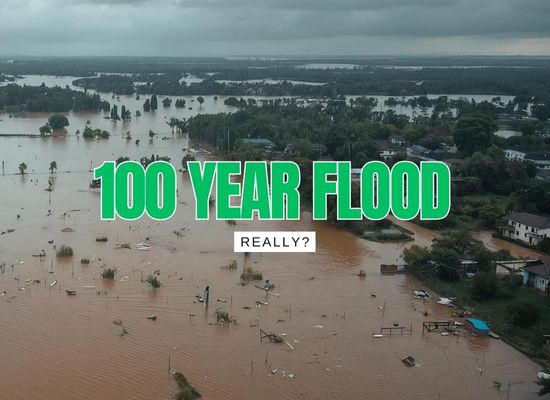
You’ve probably heard someone say, “We just had a 100-year flood, so we’re safe for the next 99.” Nope. A “100-year” label isn’t a schedule, it’s a probability shorthand for a 1% annual chance event. That chance resets every year, can happen more than once in a short window, and is getting scrambled by shifting rainfall patterns. Let’s bust the biggest myths and show the real math you can use at your kitchen table.
❌Myth: “It happens once every 100 years.”
Reality: “100-year” means a 1% chance in any given year—not a schedule. You can see two “100-year” floods in back-to-back years, or none for a century. The dice are rolled anew each year.
✅Fact: It’s a probability model
Hydrologists estimate a river’s or watershed’s flow frequency. The “return period” is just shorthand: Return period = 1 / Annual Exceedance Probability (AEP). A 1% AEP event ↔ about a 100-year return period.
❌Myth: “I’m outside the FEMA high-risk zone—so I’m safe.”
Reality: Flood maps show where federal insurance is required, not where water stops. Over 20% of NFIP claims typically occur outside the mandatory zones in many years. Risk declines with elevation, but it doesn’t vanish at a line.
✅Fact: Climate and land use shift the odds
Heavier downpours, upstream development, and local drainage changes can alter flow frequency. Today’s “1% event” might be more likely tomorrow (non-stationarity).
📚Key Terms in Plain English
| Term | What it means | Why you should care |
|---|---|---|
| Annual Exceedance Probability (AEP) | The chance a flood of a given size (or bigger) happens in a given year. | 1% AEP ≈ “100-year” flood; 0.2% AEP ≈ “500-year”. |
| Return Period | Average years between events of that size: 1/AEP. | It’s an average, not a countdown timer. |
| Base Flood (1% AEP) | The regulatory benchmark used for elevation and insurance rules. | Building above this reduces premiums and damage risk. |
| Residual Risk | Risk that remains even with levees, pumps, or detention basins. | Barriers can fail or be overtopped; plan accordingly. |
🧮What’s my chance over a mortgage?
Use this quick calculator to see the probability of at least one flood within your time horizon. It assumes a steady AEP (annual chance). Real-life risk can rise or fall—this gives you a baseline.
Probability ≥1 event
“Return period” label
Expected count
Example: A 1% AEP (“100-year”) flood has a ~26% chance over a 30-year mortgage: 1 − 0.99³⁰ ≈ 26%.
🌧️Why “100-year floods” seem to happen all the time
- People hear “rare” and assume “won’t happen to me.”
- Return period ≠ schedule. Independent odds mean clustering can happen.
- Heavier downpours shift frequency curves (non-stationary climate).
- Upstream development increases runoff speed and peak flows.
- More gauges, radar, and social media = more events documented.
- “100-year” sometimes used loosely by non-technical sources.
🗺️Flood Maps & Zones: What they do (and don’t) tell you
| Map/Zone | What it shows | Common mistake | Better approach |
|---|---|---|---|
| FEMA Special Flood Hazard Area (SFHA) | 1% AEP extent (regulatory) | “I’m outside the line, so no risk.” | Look at depth gradients, historical high water, local drainage. |
| 500-year zone (0.2% AEP) | Lower-probability, still possible | “Too rare to matter.” | Over 30 years, 0.2% AEP ≈ 5.8% chance at least once. |
| Levee-protected areas | Reduced, not zero risk | Assume levee removes risk | Budget for residual risk: interior drainage & overtopping. |
Maps are snapshots of past data + assumptions. Ask your local floodplain manager about updates in progress.
🧭Decisions: Insurance, retrofits, and low-drama prep
- Homeowners insurance doesn’t cover flood. You need NFIP or private flood insurance—even outside SFHAs.
- Preferred-risk policies in moderate-risk zones can be surprisingly affordable.
- Buy before storm season—NFIP has a typical 30-day wait.
- Elevate utilities, add backflow valves, anchor fuel tanks.
- Use flood-damage-resistant materials below design flood elevation.
- Re-grade for away-from-house drainage; maintain swales & inlets.
- Know your turn-around points and nearest high ground.
- Photograph possessions for claims; store docs in the cloud.
- Sign up for local alerts; keep plastic sheeting & water-activated bags.
🗣️How to explain it to neighbors, boards, or clients
- Replace “100-year” with “1%-annual-chance” in conversation.
- Translate to mortgage risk: “That’s about a 26% chance over 30 years.”
- Use ranges and maps: “Lower risk here, not zero.”
- Share a plan: insurance, simple retrofits, and safe routes.
🔎Cheat Sheet
| Label | AEP (annual) | Chance ≥1 in 30 years |
|---|---|---|
| “10-year” flood | 10% | 95.8% |
| “25-year” flood | 4% | 70.0% |
| “50-year” flood | 2% | 45.5% |
| “100-year” flood | 1% | 26.0% |
| “500-year” flood | 0.2% | 5.8% |
30-year probabilities computed as 1 − (1 − p)30. Real-world risk can change over time.